Guide for Nonprofits: How to Navigate the Google Analytics 4 Interface
Jun 26, 2023
To access GA4, go to the Google Analytics website (analytics.google.com) and log in with your Google account. Ensure you have the appropriate permissions to access the GA4 property you want to work with.
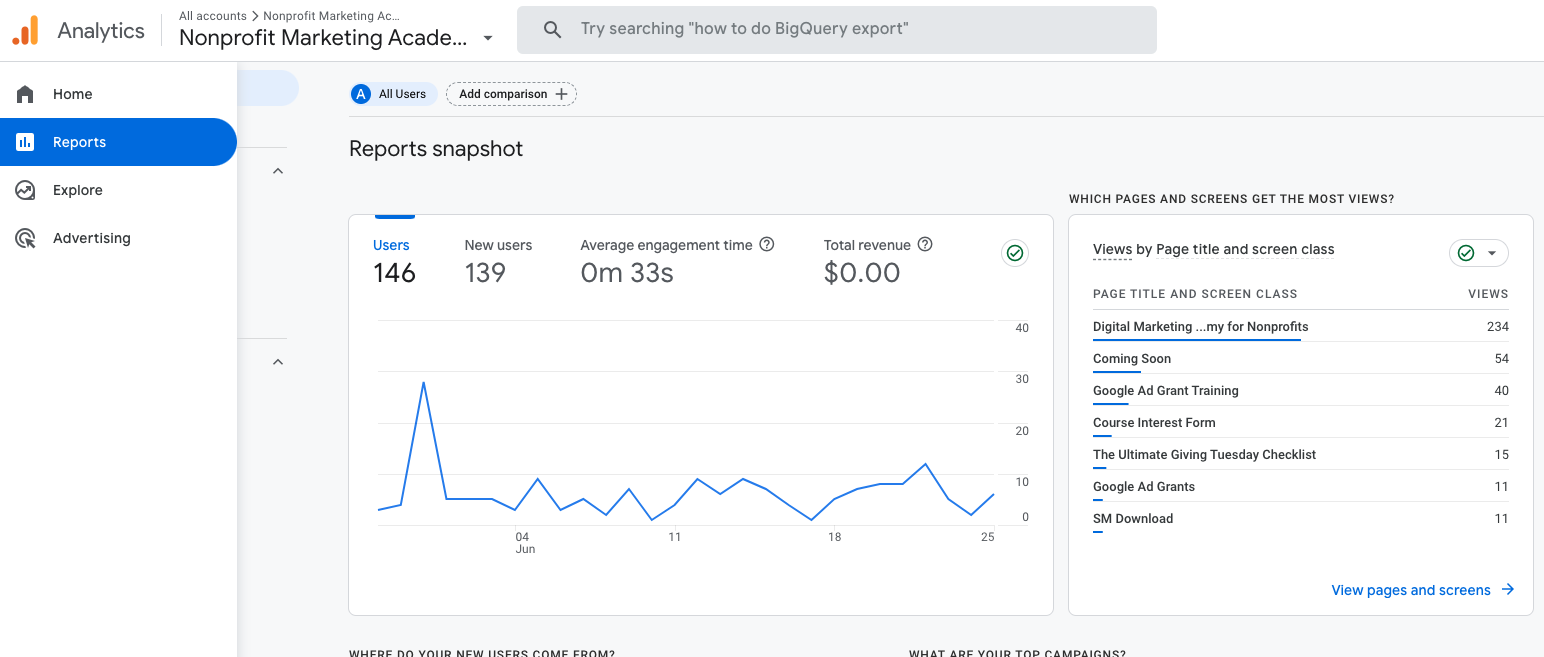
Home Tab
When you open your Google Analytics 4 property, you will land on the Home tab. The home tab provides a top-level summary of your website data, including metrics like users, new users, your reel time widget, and any custom dashboards or reports you've set up.
- The search bar allows you to look at features and articles on Google Analytics 4, like reports, or ask questions answered by intelligence to help you get started.
- Overflow Menu, an icon with three dots on the top left, shows you a tour around the new interface.
Reports Tab
Different reporting options to analyze your website data can be found in the Reports tab. These reports include realtime data on your website, how people find your website, what pages they viewed, if they converted, plus demographics and details of the devices they are using.
Realtime
The Realtime tab looks different than in Google Analytics Universal, and this is a new improvement in GA4. You can see the overview from the last 30 minutes where people are in the world, source, audience, and what events they took in realtime.
Life Cycle - Acquisition - Overview
This is an overview of where users are coming from. You can see their first and last touch (First User vs. Session). When you scroll down, you can see users by session source, medium, campaign, and more. You can choose the campaign parameters from the drop menus you want to see.
Life Cycle - Acquisition - User Acquisition & Traffic Acquisition
These tabs dive deeper into the overview. From the + sign, you can add primary and secondary parameters for your campaign.
How to set up reports or dashboards with a new interface?
- To create a new report, go to Reports - Life Cycle - Acquisition - User Acquisition.
- On the right-hand side, click customize report icon (pen).
- Choose your default Dimensions, apply, and save your report with a name.
- Go back to reports and navigate to Library.
- Navigate to Collections, and click "Edit collection," where you just created a new report.
- Search it by name, drag and drop it into your collection, and hit save.
Life Cycle - Engagement Tab - Overview
The Engagement tab tells how much time people spend on your site and what events they do.

Life Cycle - Engagement Tab - Events & Conversions
You can see your most important events and conversions on the website. You can add any event here and mark them as conversions.
Pages & Screens
The Pages & Screens tab provides insights into the performance and user engagement on specific website pages or mobile app screens.
Life Cycle - Monetization Tab
Monetization is a new term for e-commerce reporting in Google Analytics 4, where you can see revenue and purchases.
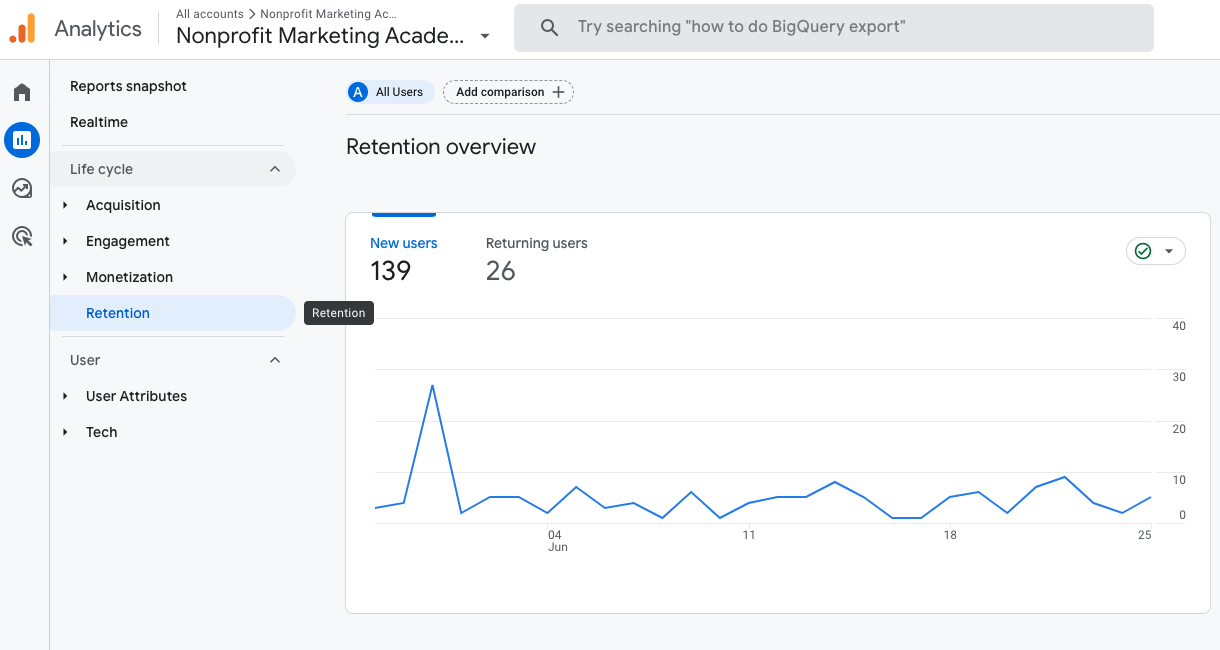
Life Cycle - Retention Tab
The retention tab tells you how many new users you have and the returning users.
User - User Attributes - Overview Demographics
Google Analytics 4 brings demographics data in one overview report that brings all the details into one report, such as country, city, gender, age, interests, and more.
User - Tech
The tech tab is an overview of reports you have seen separately in Google Analytics Universal. You can see the Operating system, device, browser, and more.
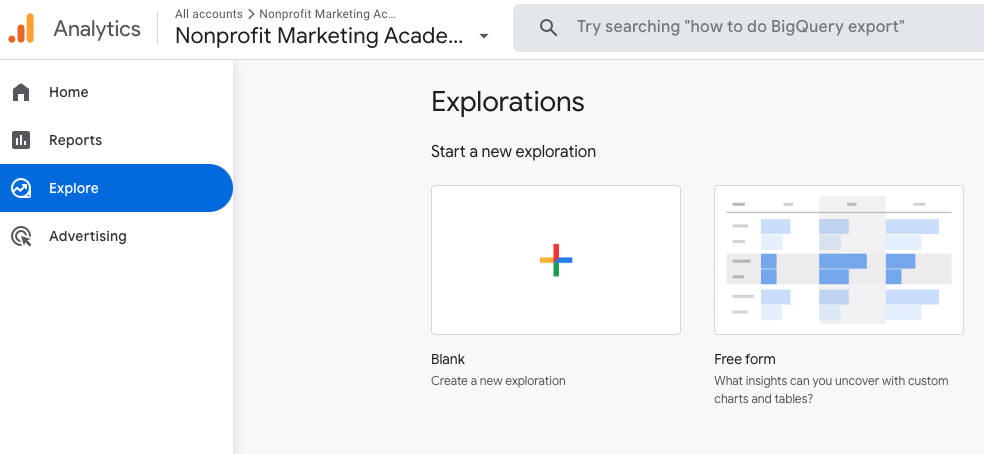
Explore - Analysis
Explore lets you create custom reports, and you can visualize data in different ways. Google Analytics 4 has a Template Gallery for reports you can use and customize to your needs.
Advertising Tab
Advertising lets you review dedicated attribution reports. It shows customers' paths between different marketing channels and how they lead to conversions on your website.
Admin Tab
The Admin tab is where you can manage the settings and configurations for your GA4 property. It includes managing user access, defining events, setting up data streams, configuring conversions, and creating custom dimensions and audiences.
Stay connected with more free nonprofit resources!
Join our mailing list to receive the latest news and updates from our team.
We hate SPAM. We will never sell your information, for any reason. Unsubscribe at any time.